


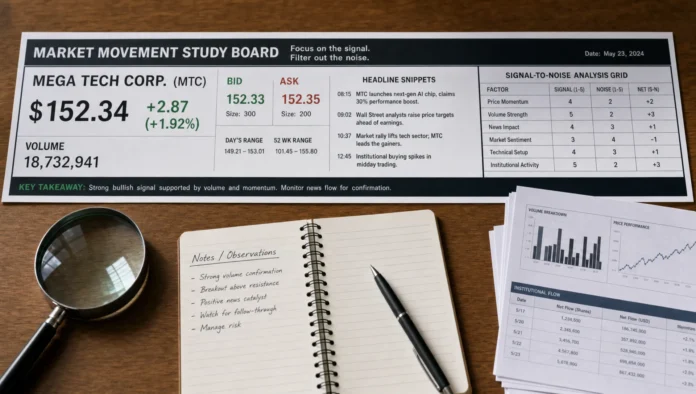
A stock ticker is often the first place investors see a market move. It flashes price, percentage change, volume, bid, ask, and sometimes breaking headlines in real time. That speed is useful, but it can also tempt investors to react before they understand what the move actually means.
The most useful tips ticker readers can apply are not about predicting the next candle. They are about building a repeatable process for separating meaningful signals from noise. A ticker does not tell you what to buy or sell by itself. It gives clues that need confirmation from volume, trend, liquidity, news, fundamentals, and the broader market.
If you are still learning the quote fields themselves, start with this Greek Shares guide on how to read ticker stocks like a smarter investor. Once the basics are clear, the next skill is knowing which changes deserve attention and which ones are simply normal market movement.
What a Market Signal Really Means
A market signal is a clue that something may be changing. It might suggest stronger demand, weaker confidence, a shift in expectations, or a temporary reaction to news. The key word is may. Signals are probabilities, not promises.
For example, a stock rising 3 percent in the first hour of trading can mean several different things. It could reflect strong earnings, sector momentum, short covering, a low-liquidity spike, or a reaction to an analyst note. Without context, the price move alone is incomplete.
Good ticker reading begins with three questions:
- What changed compared with normal behavior?
- Is another data point confirming the move?
- Does the signal matter for my time frame?
A day trader, a swing trader, and a long-term investor may look at the same ticker and reach different conclusions. That is not necessarily a contradiction. It means their time frames, risk limits, and required evidence are different.
Start With the Stock’s Normal Baseline
Before you can spot an unusual signal, you need a sense of what normal looks like. A 2 percent move may be dramatic for a large, stable company but ordinary for a small growth stock. High volume may be meaningful in one ticker and routine in another.
Build a simple baseline for any stock you follow. Look at its usual daily trading volume, average percentage move, typical bid-ask spread, recent support and resistance zones, and sensitivity to earnings or macro news. This baseline helps you avoid treating ordinary volatility as a major event.
Volume is especially important. A move on unusually high volume often deserves more attention than the same move on light volume because it suggests more participants are involved. However, volume still needs interpretation. A heavy-volume decline after bad news may show institutions selling. A heavy-volume rise after strong results may show renewed confidence. A heavy-volume move with no clear news may require extra caution.
The goal is not to memorize every number. The goal is to recognize when the ticker is behaving differently enough to investigate.
Read Price and Volume Together
Price tells you direction. Volume tells you participation. When they agree, the signal is usually stronger. When they conflict, the signal may be weaker or still unresolved.
A rising price with rising volume can suggest demand is increasing. A falling price with rising volume can suggest selling pressure is intensifying. A rising price on weak volume may still be positive, but it is less convincing because fewer participants are supporting the move.
Here is a practical way to interpret common price and volume combinations:
| Ticker clue | What it may suggest | What to verify next |
|---|---|---|
| Price rises on above-average volume | Buyers may be gaining control | Check news, sector performance, and resistance levels |
| Price falls on above-average volume | Sellers may be acting with conviction | Check whether the drop is company-specific or market-wide |
| Price rises on weak volume | Move may lack confirmation | Watch whether volume improves before acting |
| Price falls on weak volume | Pullback may be temporary | Compare with the broader market and recent trend |
| Big volume with little price progress | Buyers and sellers may be in a battle | Watch the next close and support or resistance reaction |
The close often matters more than the intraday headline move. A stock that gaps up strongly but closes near the low of the day may be showing fading demand. A stock that sells off early but closes near the high may be showing resilience.
This is where ticker reading becomes less about excitement and more about evidence. One data point can start your attention. Multiple aligned clues can justify deeper research.
Compare the Stock With the Market and Its Sector
A ticker can look strong in isolation but weak compared with its peers. It can also look weak in isolation but resilient compared with a falling market. Relative strength helps you see the difference.
If a stock is up 1 percent while its sector is up 4 percent, it may actually be underperforming. If a stock is flat while the overall market is down 2 percent, it may be showing hidden strength. The signal becomes clearer when you compare the stock with a relevant index, sector ETF, or peer group.
Relative strength is useful because money often rotates. Investors may move from growth to value, from small caps to large caps, from defensive sectors to cyclical sectors, or from risk assets to cash. A ticker move that aligns with sector rotation is usually more informative than a move that appears out of nowhere.
For a deeper framework, Greek Shares also explains how to judge bullish or bearish signals by combining price action, volume, fundamentals, and news rather than relying on one clue.
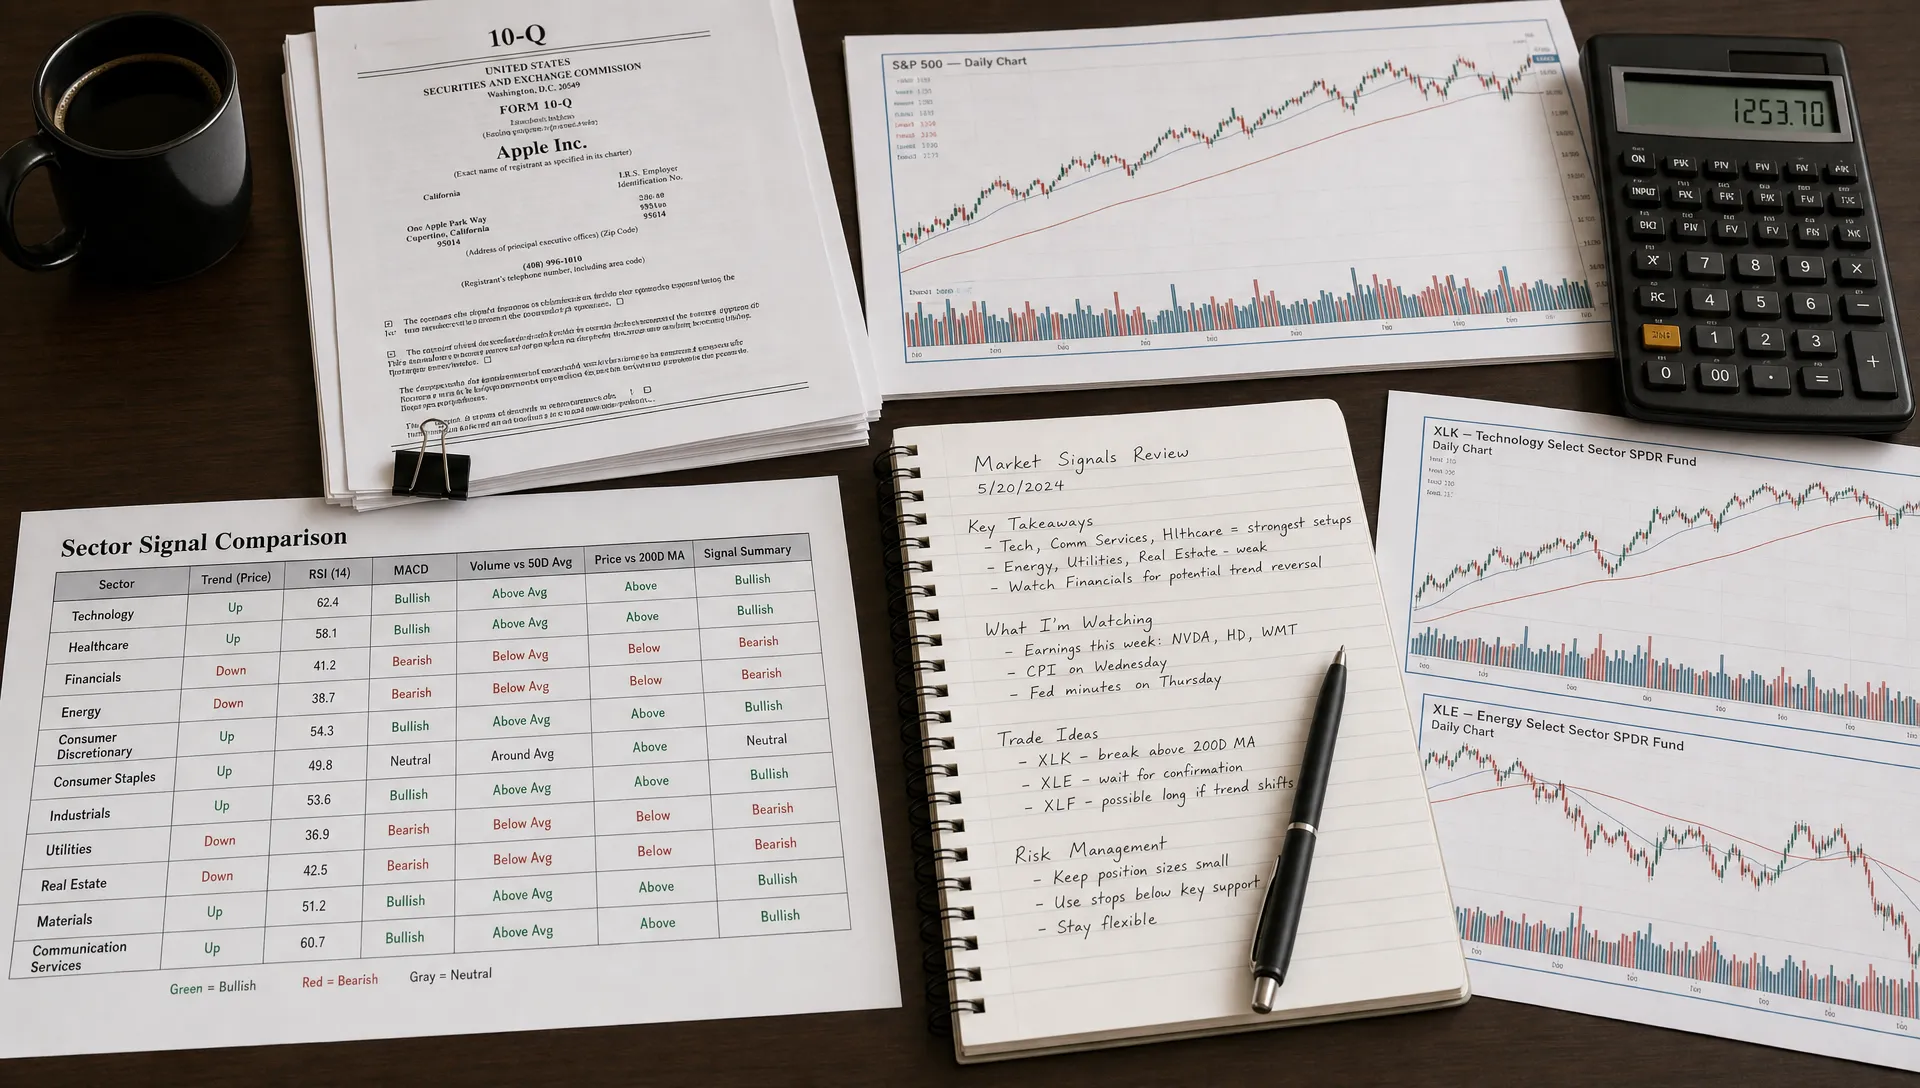
Check Liquidity Before Trusting the Signal
Not every ticker is equally reliable. Thinly traded stocks can move sharply on small orders. Wide bid-ask spreads can make the displayed price less useful. Pre-market and after-hours quotes can exaggerate movement because fewer buyers and sellers are present.
Liquidity affects both interpretation and execution. A stock showing a 5 percent move may not be easy to buy or sell near the displayed quote if the spread is wide. The signal may still matter, but the risk of slippage is higher.
Accuracy matters before interpretation. The same habit applies outside investing: when buying specialized parts, you would verify fit and specifications with a dedicated source such as Velgensupermarkt’s wheel and rim assortment before treating a product listing as actionable. With tickers, verify the symbol, exchange, security type, quote delay, and trading session before reading too much into the move.
This is especially important for companies with similar names, multiple share classes, foreign listings, exchange-traded products, or recently changed ticker symbols. A signal on the wrong security is not a signal at all.
Separate News Reactions From Lasting Information
News can create fast ticker movement, but not all news changes long-term value. A rumor, headline, analyst price target, product announcement, regulatory update, earnings release, or macroeconomic report can each move a stock for different reasons.
The first task is to identify what actually changed. Did the company report higher earnings, improve guidance, reduce debt, win a major contract, or face a new risk? Or did the ticker move because of speculation and social media momentum?
Earnings-related moves deserve special care. A company can beat earnings expectations but fall because margins weakened, guidance disappointed, or the market expected even better results. Another company can report a headline loss but rise because cash flow improved or management raised future outlook.
When possible, go beyond summaries and review primary materials such as company press releases, investor presentations, and filings in the SEC’s EDGAR database. The ticker shows the reaction. The source documents help explain whether the reaction is grounded in facts.
Use Fundamentals as a Filter
Ticker signals become more useful when they are filtered through business quality and valuation. A strong price move in a company with improving revenue, rising margins, manageable debt, and durable cash flow may deserve more attention than the same move in a company with deteriorating fundamentals.
That does not mean every good company is a good buy at any price. Valuation still matters. A ticker may show strong momentum, but if expectations are already extremely high, the stock may be vulnerable to disappointment. On the other hand, a weak ticker move in a fundamentally sound company may be an opportunity for patient investors if the decline is driven by temporary fear.
Useful fundamental filters include revenue growth, earnings quality, free cash flow, debt levels, return on capital, competitive position, and management guidance. You do not need to analyze everything at once. Start with the factors most relevant to the business model.
For example, banks require attention to credit quality and net interest margins. Software companies often require attention to recurring revenue, customer retention, and profitability trends. Commodity producers require attention to input prices, production costs, and balance sheet strength.
The ticker tells you what the market is doing now. Fundamentals help you decide whether the market may be reacting reasonably.
Watch the Broader Tape
Individual tickers do not move in a vacuum. Interest rates, inflation expectations, currency moves, credit conditions, commodities, and geopolitical risk can all influence how investors price stocks. A company-specific signal is strongest when it remains meaningful after considering the broader tape.
For instance, if nearly every stock in a sector is falling because of a macro shock, a single company’s decline may not reveal much about that company. If the whole market is weak but one stock holds support on strong volume, that resilience may be notable.
Breadth is another helpful clue. If an index is rising but only a few mega-cap stocks are carrying it, the market may be less healthy than the headline suggests. If many sectors and market caps participate in a rally, the signal may be broader and more durable.
Investors who want a calmer process can use the Greek Shares guide on how to read the current stock market without overreacting to connect ticker movements with broader conditions.
Build a Simple Ticker Signal Checklist
A checklist helps you avoid impulsive decisions when the ticker is moving quickly. It also makes your process more consistent from one stock to the next.
Use this quick checklist before acting on a market signal:
- Identify the exact ticker, exchange, and security type.
- Compare today’s move with the stock’s normal volatility.
- Check whether volume confirms or contradicts the price move.
- Compare the stock with its sector and the broader market.
- Look for verified news or filings that explain the move.
- Review whether fundamentals support the market reaction.
- Check liquidity, bid-ask spread, and trading session.
- Decide whether the signal fits your time frame and risk plan.
- Define what would prove your interpretation wrong.
The last point is often the most valuable. Good investors do not only ask what could go right. They also define what would invalidate the idea. That discipline can prevent a small mistake from becoming a large one.
Common Mistakes Ticker Readers Should Avoid
The first mistake is treating percentage change as meaning. A stock up 8 percent is not automatically strong, and a stock down 8 percent is not automatically cheap. The move has to be interpreted in context.
The second mistake is ignoring time frame. A bearish intraday signal may not matter to a long-term investor if the business remains strong and the weekly trend is intact. A bullish long-term story may not help a short-term trader who entered at a poor price with no risk control.
The third mistake is chasing every breakout. Breakouts can fail, especially if volume is weak or the move happens after extended gains. Confirmation, risk management, and position sizing matter more than excitement.
The fourth mistake is assuming news has only one interpretation. Markets react to expectations, not just facts. A company can deliver good news that was already priced in. It can also deliver mixed news that investors view more positively than feared.
The fifth mistake is relying on the ticker without a plan. A signal should lead to a research step, not an automatic trade. The process matters because no signal works all the time.
A Practical Example of Signal Reading
Imagine a stock rises 4 percent shortly after the open. The move catches your eye, but you do not act immediately. First, you compare the move with its normal daily range and see that 4 percent is unusually large. Then you check volume and find that trading activity is already well above average.
Next, you compare the stock with its sector. If the sector is flat and the stock is outperforming, the move may be company-specific. You then check for verified news and find an earnings release showing better revenue, improved margins, and stronger guidance. The bid-ask spread is narrow, and the stock holds most of its gain into the close.
That combination does not guarantee future gains, but it is a much stronger signal than price alone. Now compare it with a weaker setup: the same 4 percent rise happens on low volume, in a thinly traded stock, with no verified news, a wide spread, and a close near the day’s low. The headline percentage is identical, but the signal quality is very different.
This is the core lesson. The ticker is not a conclusion. It is the start of a structured investigation.
Frequently Asked Questions
What is the most important ticker signal to watch? No single signal is enough by itself, but price movement confirmed by unusual volume is one of the most useful starting points. It shows both direction and participation, which can justify deeper research.
Can ticker signals predict stock prices? Ticker signals can help investors identify changes in demand, supply, sentiment, or expectations, but they cannot reliably predict prices. They should be used with risk management and additional research.
How do beginners avoid overreacting to ticker moves? Beginners should slow down, check the reason for the move, compare volume and sector performance, and decide whether the signal matters for their investment time frame before taking action.
Are after-hours ticker moves reliable? After-hours moves can be informative, especially after earnings, but they often occur with lower liquidity and wider spreads. Treat them as early clues rather than final confirmation.
Keep Practicing the Skill
Learning to spot market signals is less about finding a secret indicator and more about building judgment. Watch how price, volume, news, liquidity, fundamentals, and the broader market interact. Record what you noticed, what you expected, and what happened next.
Over time, ticker reading becomes a disciplined habit. Instead of reacting to every flash of green or red, you begin to ask better questions. That is where better investing decisions start.