


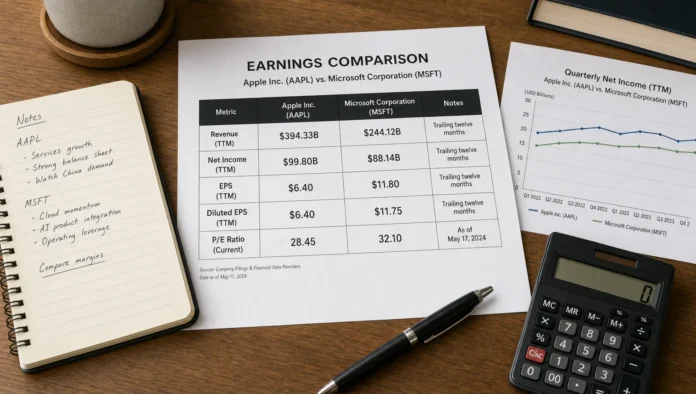
Stock earnings per share, usually shortened to EPS, is one of the most watched numbers in the stock market because it connects company profit to shareholder ownership. Revenue tells you how much money a company brings in. Net income tells you what remains after expenses. EPS goes one step further and asks a more investor-focused question: how much of that profit belongs to each share?
That simple shift matters. Investors do not buy the whole company in most cases. They buy shares. EPS helps them judge whether a company is becoming more profitable on a per-share basis, whether the current stock price is reasonable, and whether management is creating value or simply telling a good story.
But EPS can also mislead when used in isolation. A rising EPS number may reflect better operations, share buybacks, accounting changes, or a temporary one-time gain. A falling EPS number may signal trouble, or it may reflect short-term investment in long-term growth. The real skill is not memorizing the formula. It is learning how stock earnings per share shapes investing decisions without letting one metric dominate your thinking.
What EPS Actually Tells Investors
EPS measures company earnings divided by the number of shares outstanding. In its simplest form, the formula is:
EPS = Net income available to common shareholders / Weighted average shares outstanding
If a company earns $100 million and has 50 million shares outstanding, its EPS is $2.00. That means each share represents $2.00 of the company’s earnings for that period.
For a deeper breakdown of the formula, weighted average shares, and basic versus diluted EPS, Greek Shares has a dedicated guide on earnings per share explained for stock investors. Here, the focus is on how investors use EPS to make better decisions.
EPS matters because it gives shareholders a common unit of comparison. A company with $5 billion in earnings is not automatically better than a company with $500 million in earnings. The first company may have many more shares outstanding, a much higher stock price, or slower growth. EPS brings the discussion closer to what each shareholder actually owns.
Why EPS Shapes Stock Valuation
One of the most direct ways EPS affects investing decisions is through valuation. The price-to-earnings ratio, or P/E ratio, is calculated by dividing the stock price by EPS.
P/E ratio = Stock price / Earnings per share
If a stock trades at $40 and earns $2 per share, its P/E ratio is 20. Investors are paying $20 for each $1 of annual earnings.
This does not automatically mean the stock is expensive or cheap. A high P/E can be justified if investors expect strong future growth. A low P/E can be attractive, but it can also be a warning sign if earnings are declining or the business is under pressure. To understand the valuation side more fully, you can review this Greek Shares article on the P/E ratio for stock investors.
EPS shapes valuation because it is the denominator in one of the most common market ratios. When EPS rises and the stock price does not move, the P/E ratio falls, making the stock look cheaper. When EPS falls and the stock price stays high, the P/E rises, which may make investors question whether the market is too optimistic.
Here is a simplified example:
| Scenario | Stock price | EPS | P/E ratio | Possible investor interpretation |
|---|---|---|---|---|
| Company A last year | $50 | $2.50 | 20 | Fairly valued if growth is steady |
| Company A this year | $50 | $3.33 | 15 | Cheaper if earnings quality is strong |
| Company B last year | $50 | $2.50 | 20 | Similar starting point |
| Company B this year | $50 | $1.67 | 30 | More expensive unless recovery is likely |
The stock price did not change in this example, but the investment case changed significantly. That is why experienced investors watch both price and EPS, not price alone.
EPS and Market Expectations
Earnings per share does not move stocks only because of the number itself. It moves stocks because of how the number compares with expectations.
A company can report record EPS and still see its share price fall if investors expected even more. Another company can report a decline in EPS and still rise if the result is better than feared. This is why quarterly earnings reactions can feel confusing to beginners.
Markets are forward-looking. Stock prices often reflect what investors believe will happen next, not just what happened last quarter. When a company reports EPS, investors compare it with analyst estimates, management guidance, prior-year results, and the broader economic environment.
This is where EPS becomes a decision trigger. Investors may ask:
- Did EPS grow because sales increased, or because costs were cut aggressively?
- Did management raise or lower future guidance?
- Is the EPS result part of a multi-year trend, or just a one-quarter surprise?
- Did revenue, margins, and cash flow support the EPS figure?
A strong EPS number supported by revenue growth, healthy margins, and cash flow is more convincing than EPS growth caused mainly by accounting adjustments or reduced share count.
EPS Helps Compare Companies, But Only in the Right Context
EPS can help compare companies, but it works best when comparing businesses in the same sector with similar business models. Comparing the EPS of a bank with the EPS of a software company is usually not useful because their balance sheets, margins, capital needs, and growth profiles are very different.
Even within the same industry, EPS needs context. A company with lower EPS may still be a better investment if it is growing faster, reinvesting wisely, and trading at a more attractive valuation. A company with higher EPS may be mature, slow-growing, or dependent on buybacks.
The key is to compare EPS trends, not just EPS levels. A single EPS number is a snapshot. A trend tells a story.
| EPS pattern | What it may suggest | What to check next |
|---|---|---|
| Steady EPS growth | Business may be improving consistently | Revenue growth, margins, cash flow |
| Volatile EPS | Earnings may be cyclical or unpredictable | Industry cycle, debt, commodity exposure |
| EPS growth with flat revenue | Cost cuts or buybacks may be driving results | Operating expenses and share count |
| Falling EPS with rising revenue | Margins may be under pressure | Input costs, pricing power, competition |
| Negative EPS | Company is currently unprofitable | Cash burn, balance sheet, path to profit |
This approach helps investors avoid one of the most common mistakes: assuming that a higher EPS automatically means a better stock.
Basic EPS, Diluted EPS, and the Dilution Question
Investors often see two versions of EPS: basic EPS and diluted EPS. Basic EPS uses current common shares. Diluted EPS includes the potential impact of securities that could become shares, such as stock options, convertible bonds, or restricted stock units.
For decision-making, diluted EPS is often more conservative because it shows what earnings per share could look like if potential shares are added to the count. This matters especially for fast-growing companies that use stock-based compensation or companies that have issued convertible securities.
If diluted EPS is meaningfully lower than basic EPS, investors should pay attention. It may suggest that future ownership is being spread across more shares. Dilution is not always bad. If a company issues shares to fund profitable growth, shareholders may still benefit. But if dilution happens while profits stagnate, each share may represent a smaller claim on a business that is not improving.
EPS is therefore not just an earnings metric. It is also a shareholder value metric.
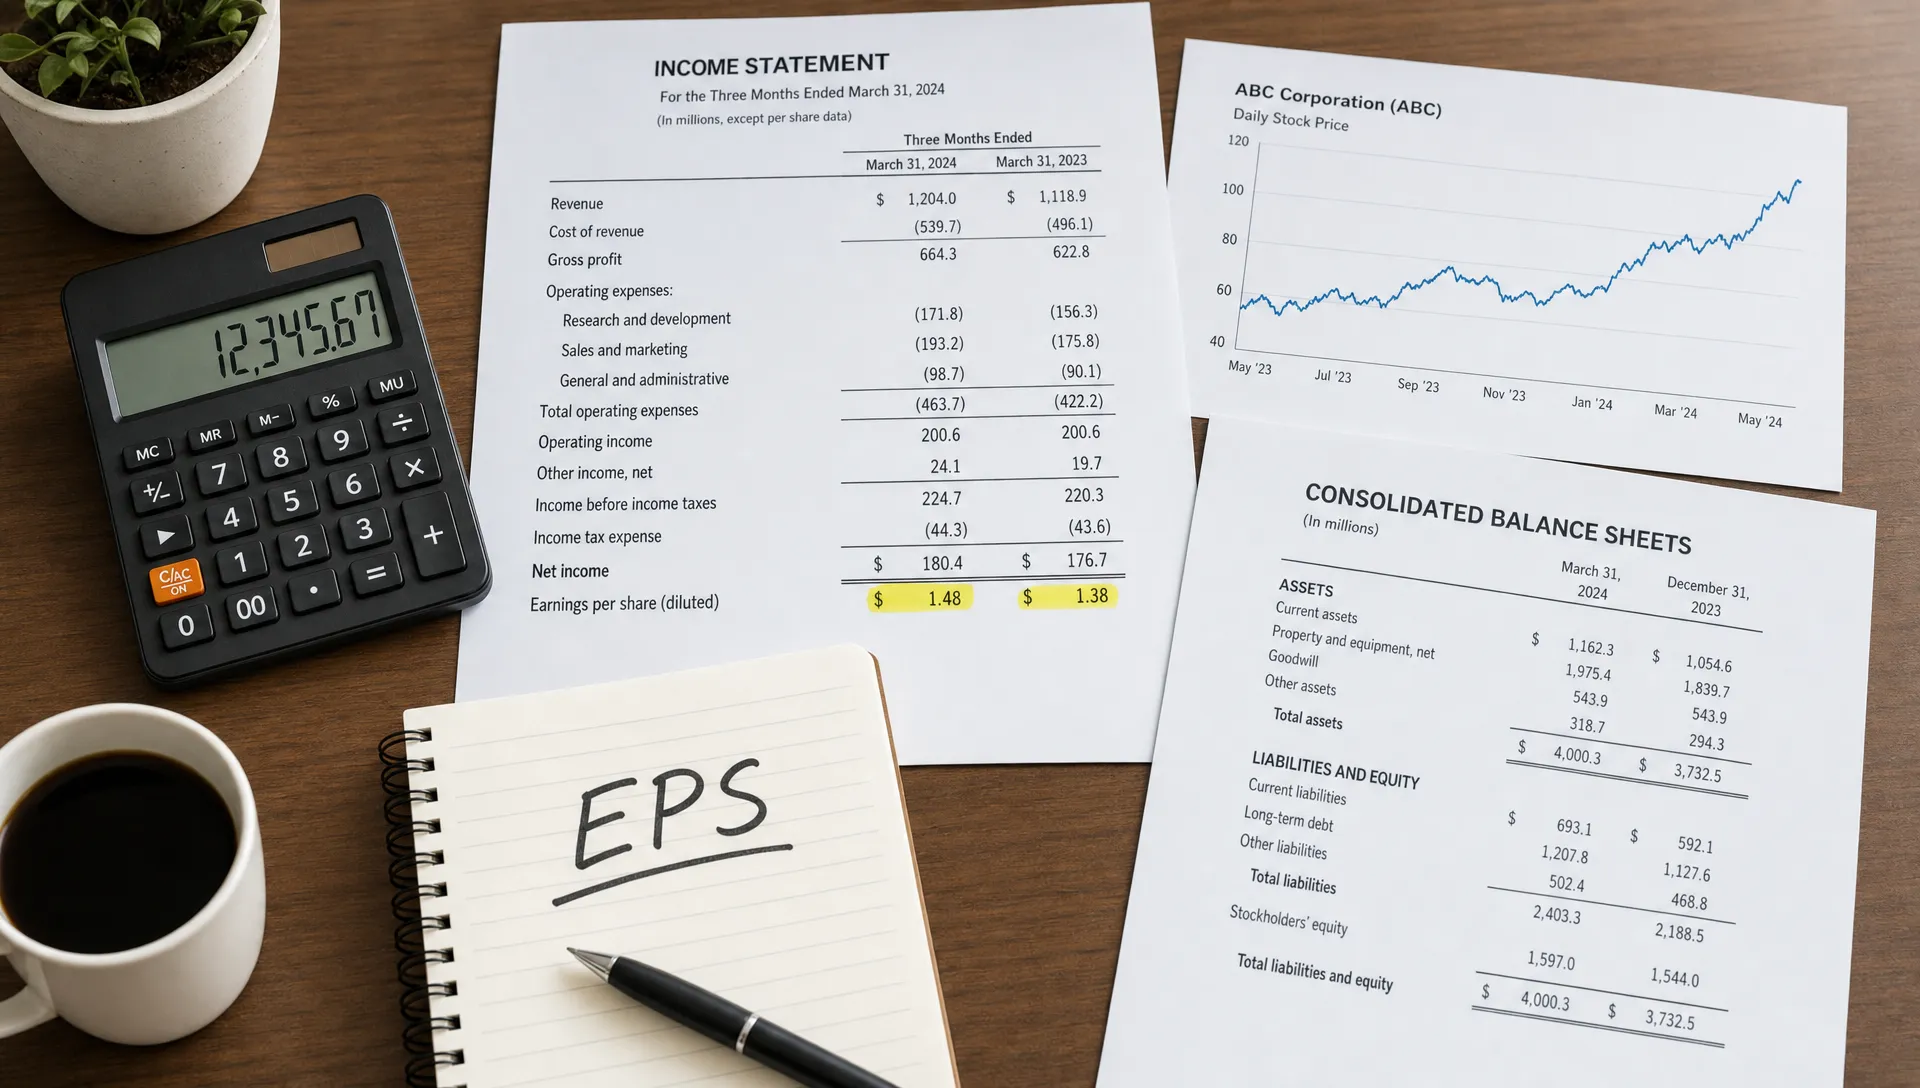
EPS and Dividend Decisions
EPS also shapes how investors think about dividends. Companies often pay dividends from earnings, although the actual cash comes from cash flow. A company with stable or growing EPS may have more room to maintain or raise dividends. A company with falling EPS may eventually face pressure if the dividend becomes too large relative to profits.
One common measure is the payout ratio:
Dividend payout ratio = Dividends per share / Earnings per share
If a company pays $1.00 in annual dividends and earns $2.50 per share, the payout ratio is 40%. If EPS falls to $1.25 while the dividend stays at $1.00, the payout ratio rises to 80%. That higher payout may still be manageable in some industries, but it leaves less room for mistakes.
Dividend investors should not rely on EPS alone. Cash flow, debt levels, capital expenditures, and business stability all matter. Still, EPS gives a useful first signal. If earnings per share cannot support the dividend over time, the dividend may eventually become vulnerable.
EPS Growth Can Come From Different Sources
Not all EPS growth is equal. This is one of the most important lessons for investors.
EPS can increase because the business is genuinely improving. Sales may be growing, margins may be expanding, and management may be allocating capital well. That type of EPS growth is usually high quality.
EPS can also rise because the company repurchased shares. Buybacks reduce the share count, so the same amount of net income is divided by fewer shares. This can be positive when shares are repurchased at reasonable prices and the company remains financially strong. But buybacks can be less attractive if they are funded with too much debt or used to cover weak operating growth.
EPS may also rise because of one-time gains, tax benefits, asset sales, or accounting adjustments. These may improve reported earnings temporarily without improving the underlying business.
A company’s EPS is part of how it communicates performance to the market, but communication should never replace analysis. In the same way that a business may use a high-converting Webflow or Framer website to present its value clearly, investors still need to look beneath the presentation and verify whether the fundamentals support the message.
How EPS Fits Into an Earnings Report
EPS is important, but it should never be the only line you read in an earnings report. A practical reading order is to start with revenue, then net income and EPS, then margins, cash flow, balance sheet strength, and guidance.
Revenue shows whether customer demand is growing. Margins show whether the company can convert sales into profit. Cash flow shows whether reported earnings are translating into real cash. Guidance helps investors understand what management expects next.
If EPS rises while revenue falls and cash flow weakens, the situation deserves caution. If EPS falls because the company is investing heavily in a new product, factory, or market expansion, the result may be less negative than it looks at first glance.
For a broader step-by-step framework, Greek Shares has a practical guide on how to read earnings reports clearly. EPS becomes more useful when it is read alongside the rest of the report, not separately from it.
Using EPS in Buy, Hold, or Sell Decisions
EPS influences investing decisions differently depending on whether you are considering a new stock, reviewing a current holding, or deciding whether to sell.
When considering a new stock, EPS helps you judge valuation and profitability. You might compare current EPS with historical EPS, future estimates, and the company’s stock price. The goal is to understand whether the market price already reflects strong growth expectations.
When holding a stock, EPS helps you monitor whether the original investment thesis remains valid. If you bought a company because you expected steady earnings growth, several quarters of weakening EPS may require a closer review. But one weak quarter does not always justify selling if the long-term case is intact.
When deciding whether to sell, EPS can reveal deterioration, but it should be combined with other signals. Selling only because EPS missed expectations can lead to emotional decisions. Selling after a clear pattern of declining earnings quality, weaker guidance, rising debt, and reduced competitiveness is a more reasoned process.
A useful EPS decision framework looks like this:
| Investor decision | EPS question to ask | Better follow-up question |
|---|---|---|
| Buy | Is EPS growing? | Is growth supported by revenue and cash flow? |
| Hold | Is EPS still aligned with my thesis? | Are temporary issues or structural problems driving changes? |
| Sell | Has EPS weakened? | Has the long-term business quality changed? |
| Avoid | Is EPS too unpredictable? | Am I being compensated for the risk through valuation? |
This keeps EPS in its proper role: important, but not absolute.
Common EPS Mistakes Investors Should Avoid
The first mistake is treating EPS as a guarantee of stock performance. A company can grow EPS and still deliver poor returns if investors paid too high a price at the start. Valuation always matters.
The second mistake is ignoring the quality of EPS. Earnings backed by recurring revenue and strong cash generation are generally more reliable than earnings driven by temporary gains.
The third mistake is comparing EPS across unrelated industries. A $5 EPS number has no meaning without the stock price, growth rate, capital structure, and industry context.
The fourth mistake is focusing only on quarterly EPS. Quarterly results are useful, but long-term investors should pay attention to multi-year trends. A good business may have occasional weak quarters. A weak business may have occasional strong quarters.
The fifth mistake is ignoring share count. If net income is flat but EPS rises because the company reduced shares, investors should evaluate whether those buybacks created real value.
A Practical EPS Checklist for Investors
Before making an investment decision based on stock earnings per share, ask these questions:
- Has EPS grown over several years, or only in the latest quarter?
- Is EPS growth supported by revenue growth?
- Are margins improving for sustainable reasons?
- Does operating cash flow confirm the earnings trend?
- Is diluted EPS close to basic EPS, or is dilution significant?
- Are buybacks improving per-share value, or masking weak growth?
- Is the stock price reasonable compared with current and expected EPS?
- Does management guidance support future earnings growth?
This checklist turns EPS from a headline number into a decision tool. It slows down the process and reduces the risk of reacting emotionally to earnings announcements.
Frequently Asked Questions
What is stock earnings per share in simple terms? Stock earnings per share is the amount of company profit assigned to each common share. It helps investors understand profitability from a shareholder perspective.
Is a higher EPS always better? Not always. A higher EPS can be positive, but investors should check how it was achieved. EPS growth from strong sales and cash flow is usually better than EPS growth from one-time gains or aggressive buybacks.
Can a company have positive EPS and still be a bad investment? Yes. A profitable company can still be overvalued, highly indebted, slow-growing, or facing competitive decline. EPS is useful, but it must be compared with price, quality, and future prospects.
Why can a stock fall after reporting strong EPS? A stock can fall if EPS was below market expectations, if guidance was weak, or if investors believe the earnings quality was poor. Stock prices react to expectations as much as reported results.
Final Thoughts
Stock earnings per share shapes investing decisions because it connects profits, valuation, expectations, dividends, and shareholder ownership. It helps investors see whether a business is improving on a per-share basis and whether the stock price makes sense relative to earnings.
The best investors do not worship EPS, and they do not ignore it. They use it as one part of a broader process. When EPS is supported by revenue growth, cash flow, disciplined capital allocation, and a reasonable valuation, it can strengthen an investment case. When EPS is isolated from those fundamentals, it can create false confidence.
If you want to build a stronger investing foundation, keep learning how earnings, valuation, risk, and business quality work together. Greek Shares offers educational guides designed to help investors move beyond headline numbers and make more informed decisions.