


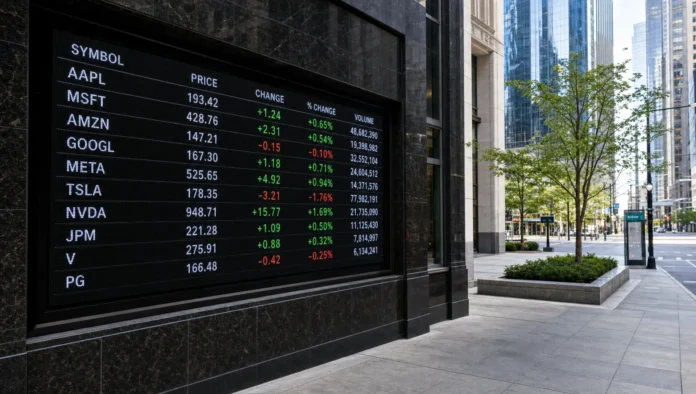
A stock ticker can look like a shortcut to quick answers: price up, price down, green, red, buy, sell. Smarter investors treat it differently. They use ticker stocks as entry points into a structured decision process, not as signals to act automatically.
A ticker symbol tells you which security you are looking at. A stock quote tells you what the market is currently willing to pay. Neither tells you, by itself, whether the investment is attractive, fairly valued, liquid, or suitable for your goals.
The real skill is learning how to read the ticker in context. That means checking the company, exchange, price movement, volume, bid-ask spread, news, fundamentals, and your own time horizon before making a decision.
What a Stock Ticker Actually Tells You
A ticker is a short code used to identify a traded security. It may represent a common stock, preferred stock, exchange-traded fund, depositary receipt, or another listed instrument. That small code helps brokers, exchanges, financial websites, and investors refer to the same security quickly.
But a ticker is not the business. It is a label. If you want a beginner-friendly explanation of the basic fields around ticker symbols, Greek Shares has a separate guide that explains shares ticker basics for first-time investors.
The smarter-investor mindset starts with one question: “What exactly am I looking at?” Two securities can have similar names, similar tickers, or even the same base company but different share classes. Some tickers also include exchange suffixes or special identifiers depending on the data provider.
Before any quote matters, ask what the underlying business or product actually is. A ticker symbol is similar to a product label: it points you to something specific, but it does not tell you whether the underlying economics are attractive. Looking at a straightforward operating business such as Greenea's microgreen growing kits and corporate gifts is a useful reminder that investors should first understand what is sold, who buys it, how demand might repeat, and what risks could affect future cash flows.
Read the Ticker From Left to Right, Then Go Deeper
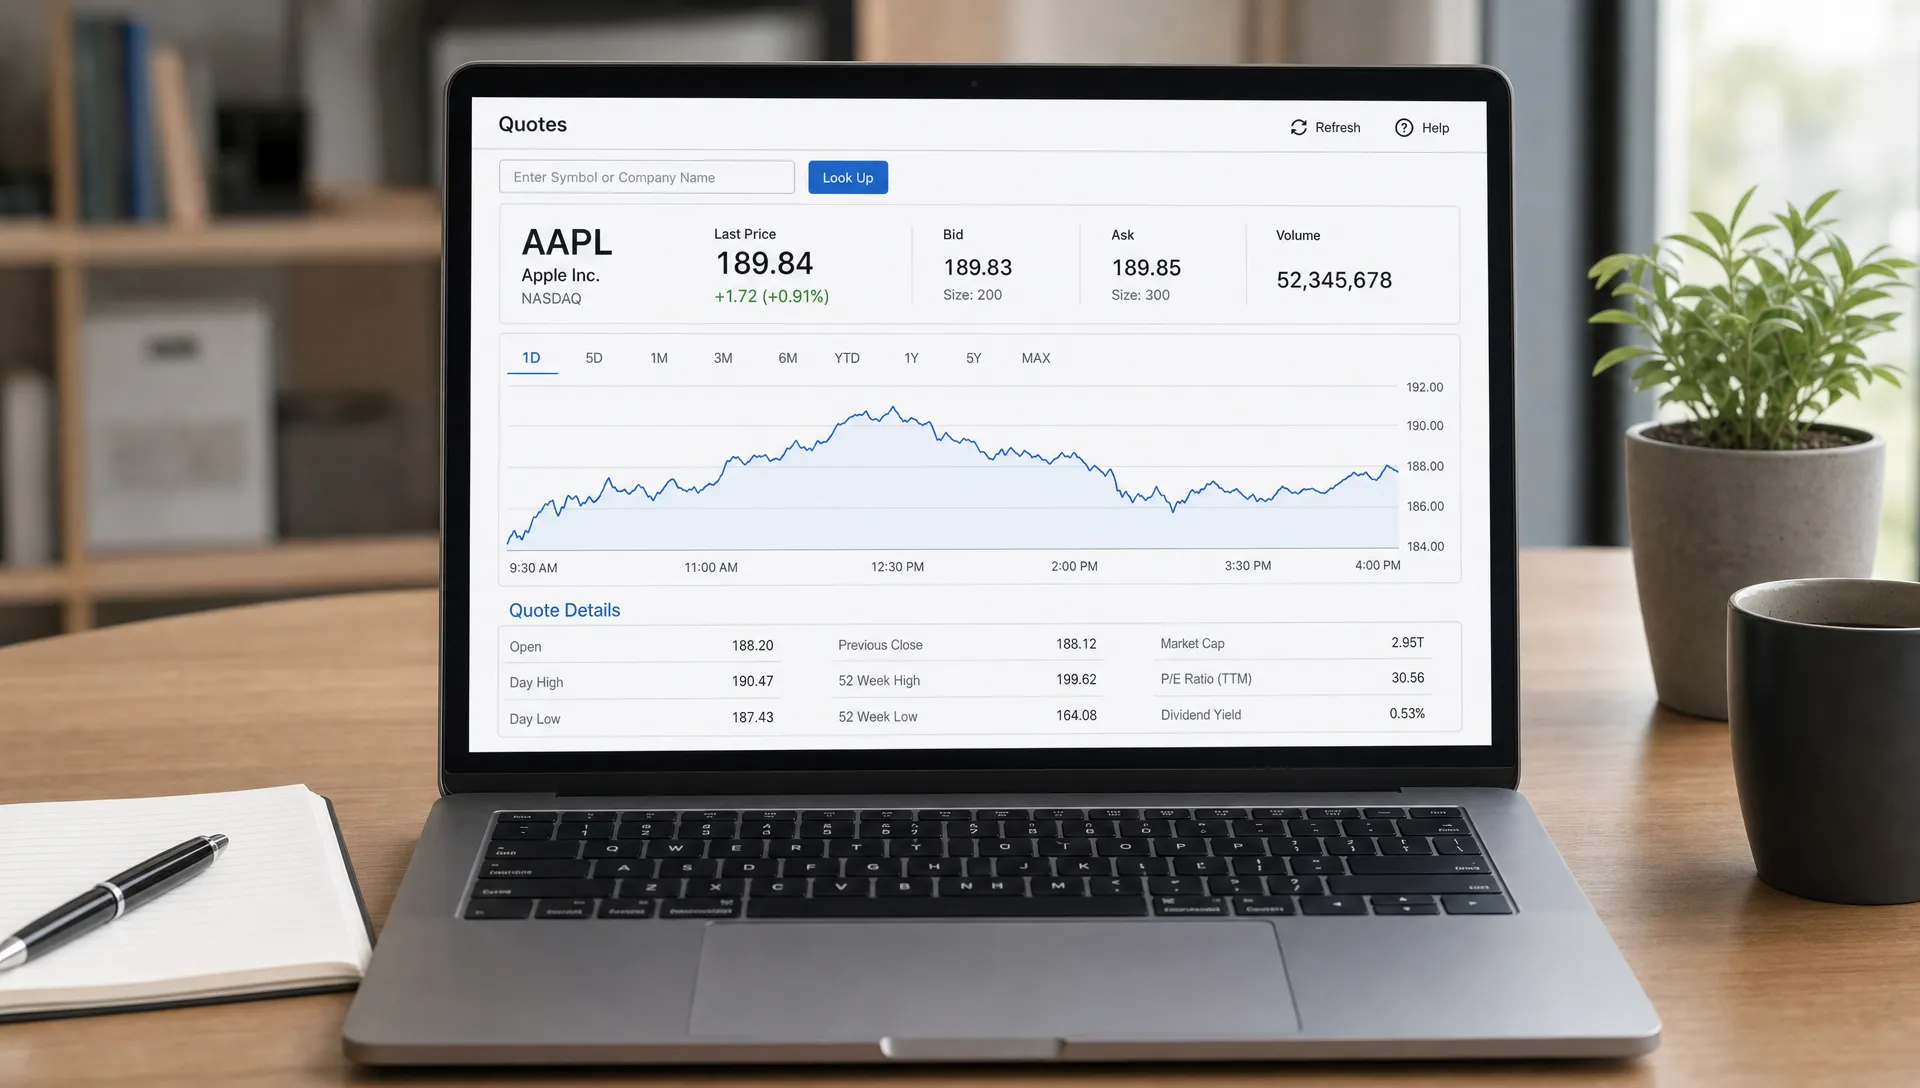
Most quote pages follow a familiar structure. They show the symbol, company name, current price, daily change, percentage change, volume, market capitalization, and sometimes valuation metrics like price-to-earnings ratio.
The mistake many beginners make is focusing only on the price change. A stock rising 4% today may still be overvalued, risky, or moving on temporary news. A stock falling 4% may be weakening for a serious reason, or it may be reacting emotionally to short-term noise.
Use the quote as a dashboard, not a verdict.
| Ticker field | What it usually means | Smarter investor question |
|---|---|---|
| Symbol | The short code for the security | Am I looking at the correct company, share class, and exchange? |
| Last price | Most recent traded price | Is this price meaningful in relation to valuation and liquidity? |
| Daily change | Move from the prior close | Is the move driven by news, market trends, or normal volatility? |
| Volume | Number of shares traded | Is interest unusually high or low compared with normal activity? |
| Bid and ask | Current buying and selling quotes | Is the spread wide enough to affect my entry or exit price? |
| Market cap | Approximate company value in the market | Does the size of the company match my risk tolerance? |
This simple table can prevent impulsive decisions. It shifts your attention from “the price moved” to “why did it move, and does it matter?”
Confirm the Identity Before You Analyze the Price
A smarter investor never assumes the first search result is the right security. This matters more than most beginners realize.
Many companies have similar names. Some companies have multiple listings. Others issue different share classes with different voting rights. International companies may trade locally and also through depositary receipts in another market. ETFs can also have tickers that look like individual stocks to new investors.
Before studying performance, confirm these basics:
- The full company or fund name
- The exchange where it trades
- The currency of the quote
- The security type, such as common stock, ETF, ADR, or preferred share
- The share class, if more than one exists
This step sounds basic, but it protects you from a surprisingly common mistake: researching one company and accidentally buying another instrument.
Look at Price Movement in a Time Frame
A ticker quote often emphasizes what happened today. That is useful, but it is incomplete. A one-day move can look dramatic even when it barely changes the longer-term trend.
A stock can be up today and still be in a long downtrend. It can be down today and still be in a strong multi-year uptrend. The time frame changes the interpretation.
For example, a 3% daily gain may mean different things depending on context. It could be a rebound after a steep decline, a breakout from a long trading range, a reaction to earnings, or simply a market-wide bounce. Without a chart and news context, the ticker does not tell you enough.
If you are learning how to connect ticker quotes with trends, support, resistance, and volume patterns, this guide on how to read stock charts clearly is a helpful next step.
Volume Tells You Whether the Move Has Participation
Volume is one of the most overlooked parts of a stock quote. It shows how many shares changed hands during a period. On its own, volume is not bullish or bearish. Its value comes from comparison.
High volume during a sharp price move suggests more participation. Low volume during a sharp move may suggest less conviction, especially in thinly traded securities. For long-term investors, volume can also reveal whether a stock is liquid enough to enter and exit without large price impact.
A useful question is: “Is today’s volume unusual compared with the stock’s average volume?” If a stock rises 8% on much higher-than-normal volume after earnings, the move may carry more information than a quiet rise on a slow trading day.
Still, volume is not proof. It is a clue. Smart investors combine it with the reason for the move, the broader market environment, and the company’s fundamentals.
Do Not Ignore the Bid-Ask Spread
The bid is the highest price buyers are currently offering. The ask is the lowest price sellers are currently requesting. The gap between them is the bid-ask spread.
For highly liquid large-cap stocks, this spread is often very small. For smaller, less liquid, or more volatile securities, the spread can be wider. That matters because the quoted “last price” may not be the price you actually receive when you buy or sell.
A wide spread can quietly increase your cost. If the bid is $10.00 and the ask is $10.30, buying at the ask and selling at the bid creates an immediate disadvantage. This is one reason market orders can be risky in thinly traded stocks.
A smarter investor checks the spread before placing an order, especially outside regular trading hours or during fast-moving news events.
Connect the Ticker Move to the News
A ticker shows what happened. News helps explain why it may have happened.
Common catalysts include earnings reports, guidance updates, analyst actions, regulatory decisions, product announcements, dividend changes, interest rate expectations, geopolitical events, and sector-wide developments.
The key is to separate meaningful news from noise. Not every headline changes a company’s long-term value. A short-term price reaction can be emotional, especially when investors are surprised.
When reading news next to ticker movement, ask three questions:
- Does this news affect revenue, costs, cash flow, debt, or competitive position?
- Is the effect likely temporary or long lasting?
- Has the stock already priced in the good or bad news?
If you want a more disciplined process, Greek Shares also explains how to interpret recent news about stock market moves without reacting too quickly.
Understand Market Cap Before You Judge Risk
Two stocks can trade at the same price and have completely different company values. A $20 stock is not automatically cheaper than a $200 stock. The share price only makes sense when combined with the number of shares outstanding.
Market capitalization is calculated by multiplying the share price by the number of shares outstanding. It gives a rough view of what the market thinks the company is worth as a whole.
| Company size category | General characteristics | Common investor concern |
|---|---|---|
| Large cap | More established, often more liquid | Slower growth or valuation risk |
| Mid cap | Mix of growth potential and operating history | Execution risk and competition |
| Small cap | Potential for faster growth, often less followed | Liquidity, volatility, and business fragility |
| Micro cap | Very small market value, often thinly traded | High volatility, limited information, and wide spreads |
These categories are general, not guarantees. A large company can be risky if it is overleveraged or declining. A smaller company can be strong if it has durable growth and a solid balance sheet. The ticker gives you the quote. Market cap helps you interpret scale.
Watch for Corporate Actions
Corporate actions can change what a ticker quote appears to show. Stock splits, reverse splits, dividends, spin-offs, mergers, and ticker changes can all affect historical charts and investor interpretation.
A stock split lowers the price per share while increasing the number of shares, without directly changing the company’s total value at the moment of the split. A reverse split does the opposite. Dividends may cause a stock price to adjust on the ex-dividend date. A spin-off can make historical performance harder to compare unless the chart is adjusted.
This is why a sudden price drop is not always bad news. Sometimes it reflects an adjustment. Before assuming something dramatic happened, check whether a corporate action took place.
Compare the Ticker to Its Sector and the Market
A stock does not move in isolation. If a bank stock falls 2% on a day when the entire banking sector drops 3%, the stock may actually be holding up better than peers. If a technology stock rises 1% while its sector rises 4%, it may be underperforming despite being green.
This relative view helps you avoid emotional conclusions. The color of the ticker, green or red, is only part of the story.
Compare the stock with:
- Its main sector or industry group
- A relevant index
- Similar companies
- Its own historical valuation range
- The broader interest rate and economic environment
Relative performance does not replace fundamental analysis, but it helps you understand whether a move is company-specific or market-driven.
Build a Smarter Ticker Reading Routine
A repeatable routine is better than reacting differently every time a ticker flashes. The goal is not to predict every price move. The goal is to make fewer careless decisions.
A practical routine might look like this:
- Confirm the exact security, exchange, currency, and share class.
- Check the current price, daily change, bid-ask spread, and volume.
- Compare the move with the stock’s chart and longer-term trend.
- Read the relevant news or company announcement behind the move.
- Review basic fundamentals such as revenue trends, profitability, debt, valuation, and cash flow.
- Compare the stock with sector peers and the broader market.
- Decide whether the idea fits your strategy, time horizon, and risk limits.
This process slows you down in a good way. It turns a ticker from a flashing signal into a research starting point.
Common Mistakes When Reading Ticker Stocks
Ticker data is useful, but it can also mislead investors who read it too narrowly. The most common mistakes usually come from overconfidence, speed, or lack of context.
| Mistake | Why it hurts investors | Better habit |
|---|---|---|
| Judging value by share price alone | A low price does not mean a stock is cheap | Use valuation metrics and market cap |
| Chasing big daily gainers | Momentum can reverse quickly | Ask what caused the move and whether it is sustainable |
| Ignoring liquidity | Thin trading can create poor execution | Check volume and bid-ask spread |
| Confusing similar tickers | You may analyze or buy the wrong security | Verify name, exchange, and security type |
| Treating news as automatically bullish or bearish | Markets often price in expectations before headlines | Compare news with prior expectations and valuation |
The smarter approach is patient and evidence-based. You do not need to understand every market signal perfectly. You need enough context to avoid acting on incomplete information.
The Bottom Line
Reading ticker stocks like a smarter investor means looking beyond the symbol and the daily price change. The ticker is where the research begins, not where it ends.
Start by confirming the exact security. Then study price movement, volume, bid-ask spread, news, valuation, market cap, and sector context. Most importantly, connect the ticker to your own investing plan. A stock that looks exciting on a screen may still be unsuitable for your goals, risk tolerance, or time horizon.
Smart investing is not about reacting faster than everyone else. It is about asking better questions before you act.
Frequently Asked Questions
What are ticker stocks? The phrase usually refers to stocks identified or tracked by their ticker symbols. A ticker symbol is the short code used to find a security on an exchange, trading platform, or financial website.
Does a stock ticker tell me if a stock is a good investment? No. A ticker helps you identify the security and read quote data, but it does not prove quality or value. You still need to evaluate the business, financials, valuation, risks, and your own investment goals.
Why do some companies have more than one ticker? Companies may have different share classes, listings on multiple exchanges, or depositary receipts in other markets. Each security can have different rights, currencies, or trading venues.
Is a low-priced stock cheaper than a high-priced stock? Not necessarily. Share price alone does not determine value. Market capitalization, earnings, cash flow, debt, growth prospects, and valuation ratios provide better context.
Should beginners use market orders when buying stocks? Beginners should be careful with market orders, especially for thinly traded stocks or during volatile periods. Checking the bid-ask spread and considering limit orders can help control execution price.
Keep Building Your Investing Process
If you want to become more confident reading ticker stocks, keep practicing with a clear checklist instead of reacting to green and red price moves. Greek Shares offers educational guides, investing articles, and market learning resources to help you improve your financial literacy over time.
Use each ticker as a starting point, then do the work behind the symbol. That is how a quote becomes insight, and how insight becomes a smarter investment decision.