


Stock market statistics are everywhere. Financial media reports daily point moves, social feeds highlight eye-catching charts, and brokerage apps can make every percentage change feel urgent. But most investors do not need more numbers. They need better filters.
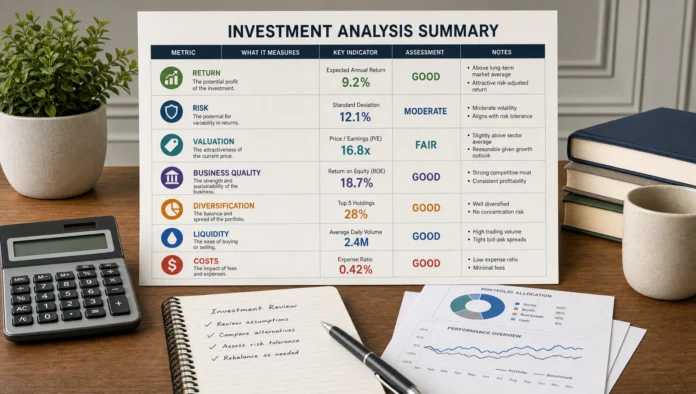
The useful question is not, “What statistic is everyone watching today?” It is, “Which statistic helps me make a better investment decision?” For long-term investors, the most valuable data usually connects to return, risk, valuation, business quality, diversification, and personal goals.
This guide focuses on the stock market statistics that actually matter, how to interpret them, and which numbers deserve less attention than they usually receive.
What Makes a Stock Market Statistic Useful?
A statistic is useful when it improves judgment. It should help you answer at least one of four questions:
| Investor question | Useful statistics | Why it matters |
|---|---|---|
| What return can I reasonably expect? | Total return, CAGR, dividend yield, earnings growth | Helps set realistic expectations |
| What risk am I taking? | Volatility, maximum drawdown, beta, debt levels | Helps prevent panic and overexposure |
| Am I paying a fair price? | P/E ratio, CAPE, earnings yield, free cash flow yield | Connects price to business fundamentals |
| Is my portfolio balanced? | Sector weights, geographic exposure, concentration, correlation | Reduces dependence on one outcome |
A statistic is less useful when it creates emotion without context. “The Dow fell 500 points” may sound dramatic, but 500 points means something very different when the index is at 10,000 versus 40,000. Percentages, time horizons, and valuation context usually tell a better story.
1. Total Return Matters More Than Price Return
One of the most common mistakes investors make is looking only at price changes. Price return shows how much a stock or index price moved. Total return includes dividends and assumes those dividends are reinvested.
That difference can be large over long periods. Dividends may seem small in any single year, but reinvested dividends can meaningfully affect long-term compounding. This is why index providers such as S&P Dow Jones Indices publish both price-return and total-return versions of major indexes.
For investors, the practical lesson is simple: when comparing performance, use total return whenever possible. A dividend-paying stock, ETF, or index fund may look less impressive on a price chart than it really was for an investor who reinvested distributions.
If you are calculating your own results, include:
- Price appreciation
- Dividends received
- Reinvested dividends
- Fees and commissions
- Taxes, if measuring after-tax return
For beginners who want a simple way to understand this, Greek Shares has a helpful guide to using a stock market returns calculator and comparing simple return, total return, and CAGR.
2. CAGR Is Better Than the “Average Return”
The average annual return can be misleading because markets compound. If a portfolio falls 50% one year and rises 50% the next, the average return is 0%, but the investor is still down 25% overall.
CAGR, or compound annual growth rate, solves this problem. It shows the annualized rate that would take your starting value to your ending value over a given period.
The formula is:
| Metric | What it tells you | Best use |
|---|---|---|
| Simple return | Total gain or loss over a period | Short, one-period comparisons |
| Average annual return | Arithmetic average of yearly returns | Rough performance summary |
| CAGR | Annualized compounded return | Long-term investment comparison |
Long-term stock market datasets, including NYU Stern data maintained by Aswath Damodaran, show that broad U.S. equities have historically delivered strong long-term returns. But those returns did not arrive smoothly. Some years were excellent, some were flat, and some were deeply negative.
That is why CAGR matters. It respects the path investors actually experience.
3. Real Return Tells You What You Actually Gained
A 7% investment return is not the same in a 2% inflation environment as it is in an 8% inflation environment. Real return adjusts for inflation and shows the increase in purchasing power.
The simplified formula is:
| Nominal return | Inflation rate | Approximate real return |
|---|---|---|
| 8% | 2% | 6% |
| 8% | 4% | 4% |
| 8% | 7% | 1% |
Inflation matters because investors do not spend percentages. They spend money on housing, food, energy, healthcare, education, and retirement needs. A portfolio that grows in nominal terms but fails to outpace inflation may not improve financial security.
For U.S. investors, the Bureau of Labor Statistics Consumer Price Index is one common inflation reference. Investors in other countries should compare returns against the inflation rate relevant to their own spending and currency.
4. Volatility Is Normal, but Drawdowns Test Behavior
Volatility measures how much returns move around their average. It is useful, but it can feel abstract. Maximum drawdown is often more intuitive because it shows the largest peak-to-trough decline over a period.
For example, a portfolio with a 10% long-term return may still suffer a 30% decline along the way. If the investor sells during that drawdown, the long-term average becomes irrelevant.
J.P. Morgan Asset Management’s widely followed Guide to the Markets has repeatedly shown that the S&P 500 has experienced significant intra-year declines even in many years that finished positive. The exact figures vary by year and period, but the lesson is consistent: temporary declines are a normal part of equity investing.
The statistic that matters is not just “how much can this investment return?” It is also “how much could it fall before I am tempted to abandon the plan?”
| Risk statistic | What it measures | Investor takeaway |
|---|---|---|
| Standard deviation | How widely returns fluctuate | Higher values usually mean a bumpier ride |
| Maximum drawdown | Largest decline from peak to trough | Helps estimate emotional and financial stress |
| Beta | Sensitivity to market movements | Useful for comparing a stock to the broader market |
| Sharpe ratio | Return per unit of volatility | Helpful when comparing diversified strategies |
| Downside capture | How much an investment falls in weak markets | Useful for risk-aware portfolio construction |
The best risk statistic is the one that changes your behavior before a crisis. If you know a stock-heavy portfolio can fall sharply, you are more likely to size it appropriately and less likely to panic during normal market stress.

5. Valuation Statistics Help Set Expectations
Valuation does not predict next week’s market move. It is much more useful for estimating long-term return potential and comparing opportunities.
The most common valuation metric is the price-to-earnings ratio, or P/E ratio. It compares a company’s share price to its earnings per share. A high P/E can mean investors expect strong growth, but it can also mean optimism is already priced in. A low P/E can signal value, but it can also reflect poor business prospects.
Useful valuation statistics include:
- P/E ratio: Price divided by earnings per share.
- Forward P/E: Price divided by expected future earnings.
- Earnings yield: Earnings divided by price, which is the inverse of P/E.
- Price-to-sales ratio: Helpful when profits are temporarily low or negative, but risky if used alone.
- Free cash flow yield: Free cash flow divided by market value.
- CAPE ratio: Cyclically adjusted P/E, often used for broad market valuation.
The Robert Shiller online data is a well-known source for long-term U.S. market valuation history, including CAPE. CAPE can be helpful because it smooths earnings over a long period, reducing the distortion of a single unusually good or bad year.
Still, valuation is not a timing tool by itself. Expensive markets can become more expensive, and cheap markets can stay cheap. For everyday investors, valuation works best when combined with business quality, balance sheet strength, earnings trends, and portfolio discipline. If you want a broader process, Greek Shares explains the main building blocks in its guide to stock market analysis basics.
6. Earnings Growth and Cash Flow Matter More Than Hype
Over time, stock prices are tied to business results. Market sentiment can dominate in the short run, but earnings and cash flow usually matter more over longer periods.
Investors should pay attention to:
| Business statistic | Why it matters | What to watch for |
|---|---|---|
| Revenue growth | Shows demand for products or services | Growth that is slowing, accelerating, or dependent on one product |
| Gross margin | Shows production or service profitability | Margin pressure from costs or competition |
| Operating margin | Shows core business efficiency | Improving or deteriorating operating leverage |
| Net income | Shows accounting profit after expenses | One-time gains or charges that distort results |
| Free cash flow | Shows cash left after capital spending | Businesses that report profits but burn cash |
| Return on invested capital | Shows how efficiently capital is used | High returns that are sustainable or fading |
A company can report impressive revenue growth while producing weak cash flow. Another company may have modest growth but excellent margins, strong cash generation, and disciplined capital allocation. The better investment is not always the faster-growing business.
Annual reports and quarterly filings are the best starting points. For U.S.-listed companies, investors can find official filings through SEC EDGAR. Reading these documents is slower than scanning headlines, but it gives investors direct access to the numbers management is legally required to report.
7. Balance Sheet Statistics Show Survival Risk
A stock can look cheap because the business is temporarily misunderstood. It can also look cheap because the company is financially fragile.
Balance sheet statistics help investors distinguish between opportunity and danger. The most important include debt, cash, interest coverage, current ratio, and debt maturity schedule.
Interest coverage is especially useful when rates are higher or credit conditions are tightening. It compares operating profit with interest expense. A company with falling profits and rising interest costs may face pressure even if its stock appears inexpensive.
This is one reason interest rates matter so much to investors. Higher rates can affect borrowing costs, consumer demand, bond yields, and stock valuations. Greek Shares covers this connection in more detail in its explainer on why interest rates matter to investors.
A strong balance sheet does not guarantee a good investment, but a weak balance sheet can turn a normal downturn into a permanent loss.
8. Market Breadth Reveals What Index Levels Hide
An index can rise even when many of its individual stocks are struggling. This often happens when a small group of large companies carries most of the return.
Market breadth statistics help investors see beneath the headline index. Common breadth measures include the percentage of stocks above their 50-day or 200-day moving averages, the advance-decline line, and the number of stocks making new highs versus new lows.
Breadth is not perfect, but it can reveal whether a rally is broad and healthy or narrow and concentrated. A narrow rally does not automatically mean a crash is coming. It simply means index performance may depend heavily on a smaller number of companies.
That matters because many popular indexes are market-cap weighted. The larger a company becomes, the more influence it has on the index. In recent years, the largest U.S. companies have represented an unusually large share of major indexes. Investors who own broad index funds may still be more concentrated than they realize.
The practical question is not, “Is concentration bad?” It is, “Do I understand what I actually own?”
9. Sector and Geographic Exposure Are Portfolio Statistics, Not Trivia
Investors often focus on individual stock returns while ignoring the structure of the full portfolio. That can create accidental risk.
For example, an investor may own several different funds but still be heavily exposed to the same large technology companies. Another may own international stocks but have most revenue exposure tied to the same region or currency.
Useful portfolio exposure statistics include:
| Portfolio statistic | What it reveals | Why it matters |
|---|---|---|
| Sector allocation | Exposure to industries such as technology, healthcare, energy, or financials | Prevents overdependence on one economic theme |
| Geographic allocation | Exposure by country or region | Helps manage currency and political risk |
| Top 10 holdings weight | Concentration in the largest positions | Shows whether diversification is real or superficial |
| Correlation | How investments move relative to each other | Helps identify holdings that may fall together |
| Cash allocation | Dry powder and stability | Supports liquidity and emotional discipline |
Diversification is not about owning many things. It is about owning assets that do not all depend on the same outcome.
10. Liquidity and Volume Matter Most When You Need to Trade
Long-term investors do not need to obsess over every volume spike. But liquidity still matters, especially for smaller stocks, thinly traded ETFs, and stressed markets.
Trading volume shows how many shares change hands. Bid-ask spread shows the gap between the price buyers are willing to pay and sellers are willing to accept. A wide spread is a hidden cost because investors may pay more to buy and receive less when selling.
Liquidity statistics matter most when:
- You invest in small-cap or micro-cap stocks
- You trade options or complex ETFs
- You need to sell quickly
- Markets are under stress
- A position is large compared with normal trading volume
For most long-term investors in highly liquid funds or large companies, liquidity is usually not the main risk. For concentrated investors or traders, it can be crucial.
11. Macro Statistics Matter, but Only in Context
Economic data can move markets, but the market reaction often depends on expectations. A jobs report may look strong, but stocks can fall if investors believe it increases the chance of higher interest rates. Inflation can decline, but stocks may still drop if the decline is smaller than expected.
Important macro statistics include inflation, unemployment, wage growth, GDP growth, central bank rates, credit spreads, and purchasing managers’ indexes. These indicators help investors understand the environment in which companies operate.
However, macro data should not become a reason to constantly change strategy. Most investors are better served by asking how the data affects earnings, valuations, financing costs, and risk appetite.
A simple framework works well:
| Macro statistic | Direct market relevance | Investor interpretation |
|---|---|---|
| Inflation | Affects purchasing power and interest rates | Higher inflation can pressure valuations and margins |
| Policy rates | Affect discount rates and borrowing costs | Higher rates often raise the hurdle for stocks |
| Unemployment | Reflects labor market strength or weakness | Very weak labor data can signal recession risk |
| Credit spreads | Show stress in lending markets | Wider spreads may signal rising default concerns |
| GDP growth | Measures broad economic activity | Slower growth can pressure cyclical earnings |
Macro statistics are useful when they improve context. They are dangerous when they encourage overconfidence in short-term forecasts.
12. Costs Are One of the Few Statistics Investors Can Control
No investor controls market returns. Few can reliably forecast earnings surprises or central bank decisions. Costs, however, are largely controllable.
Expense ratios, trading commissions, bid-ask spreads, fund turnover, and taxes can all reduce net returns. A small annual fee difference may look harmless, but over decades it can compound into a meaningful gap.
This does not mean the cheapest investment is always best. It means every cost should have a reason. If a fund charges more, investors should understand what they are paying for and whether the results justify it.
The most important performance statistic is not gross return. It is the return you keep after fees, taxes, and avoidable mistakes.
Stock Market Statistics That Deserve Less Attention
Some statistics are not useless, but they are often overemphasized.
Daily point moves are one example. Percentage changes are better, and even those need context. A one-day move rarely changes the long-term value of a diversified portfolio.
All-time highs are another misunderstood statistic. Investors sometimes fear buying near highs, but markets that compound over time naturally make new highs. A high price alone does not prove overvaluation. The better question is whether earnings, cash flow, and future expectations justify the price.
Short-term forecasts also deserve caution. Year-end index targets, recession probability headlines, and one-number predictions can sound precise, but markets are complex. Investors should treat forecasts as scenarios, not instructions.
A Practical Investor Dashboard
Instead of tracking dozens of numbers every day, investors can create a simple dashboard. The goal is not to predict every market move. The goal is to stay informed without becoming reactive.
| Frequency | Statistics to review | Purpose |
|---|---|---|
| Weekly or monthly | Portfolio return, allocation, cash level | Stay aware without overtrading |
| Quarterly | Earnings, revenue, margins, free cash flow | Check whether business fundamentals are improving |
| Semiannually | Valuation, sector exposure, concentration | Rebalance expectations and risk |
| Annually | CAGR, total return, fees, tax impact, goal progress | Measure whether the plan is working |
The best statistics are decision-linked. If a number does not affect what you would buy, sell, hold, rebalance, or study more carefully, it probably does not need much attention.
Frequently Asked Questions
What are the most important stock market statistics for beginners? Beginners should focus on total return, CAGR, valuation, diversification, fees, and maximum drawdown. These statistics explain what you earned, what you paid, how much risk you took, and whether your portfolio is balanced.
Is the P/E ratio the best stock valuation statistic? The P/E ratio is useful, but it is not enough by itself. Investors should compare it with earnings growth, profit margins, free cash flow, debt levels, and the company’s own history.
How often should investors check stock market statistics? Long-term investors usually do not need to check market data daily. Monthly portfolio reviews, quarterly business reviews, and annual performance reviews are often more useful than constant monitoring.
Do stock market statistics predict crashes? No statistic reliably predicts crashes on its own. Valuation, credit spreads, market breadth, and sentiment can show risk levels, but they should be used as context rather than precise timing signals.
Why does total return matter more than price return? Total return includes dividends, while price return does not. Over long periods, reinvested dividends can make a significant difference in an investor’s actual wealth.
Use Statistics to Improve Decisions, Not to Chase Certainty
The stock market will always produce more data than any investor can process. The advantage comes from knowing which statistics connect to real decisions.
Focus on total return, real return, valuation, earnings quality, balance sheet strength, drawdowns, diversification, liquidity, macro context, and costs. Ignore the noise that creates urgency without improving understanding.
Greek Shares is built to help investors strengthen that kind of disciplined thinking through investing education, market guides, financial terminology, and practical tutorials. Use the numbers, but do not let the numbers use you.